How Germany Is Able To Run The World’s Second Largest Export Economy In The Post-Industrial Era
“The Germany Shock” describes European growth & the efficiency-maximizing centralization of European manufacturing activity after the launch of the Single Market and the Euro.
Two questions sparked this: 1) why did Europe only adopt the Euro & the Single Market after its Cold War-era existential challenge was over, and 2) how has Germany maintained an export-oriented Industrial Manufacturing Powerhouse while every other developed nation is going post-Industrial?
“The Germany Shock” — a summary:
Germany is a major outlier among high-GDP developed nations and nobody talks about it
International trade is a primary source of German economic prosperity
Only China runs a larger Surplus from Trade
No other nation has a customer base anywhere near as diversified as Germany
A China-USA Manufacturing Case Study:
i) It is possible for a region to straight up lose at trade
International competition can reduce employment in one geographic region without producing an offsetting increase in employment in that same region
ii) Manufacturing Network Effects: 3 - 1 = 0
When the primary economic engine leaves a community, all the supporting economic activity leaves too, from barbershops to component suppliers
iii) Exchange rates are a Cheat Code for selling stuff — you might not be willing to cheat, but China is
When China undervalues its currency, Chinese goods start looking real cheap
Foreigners then buy way more Chinese goods than they otherwise would have
iv) The price of your currency is a reflection of how desirable your whole nation’s economy is
The more successful your nation is, the more expensive it becomes for you to fight the free market and maintain the fiction of a cheap — undesirable — currency
China deals with this via intense autocratic market interventions that are unthinkable in the West or — when tried in our free markets — lead immediately to failure
Case Study Takeaway:
v) The price of industrial success is eventual failure: Industrial Exporter nations tend to become stable, regionally dominant economies…
…their currencies then become highly sought-after “Reserve Currencies” — making their products expensive and undermining the export-driven success that made their economies so great in the first place
This spells doom for Germany because of how dependant they are on selling to other countries
The German Solution:
vi) The European Single Market functions to make German goods maximally attractive to trading partners within the EU by raising the effective-cost of imported goods
vii) The German Euro — the currency — then has its value suppressed via contamination with all the other (poorer-performing, non-Exporting) European nations
This means German goods look cheaper than they otherwise would to non-EU markets
Result:
viii) The Euro & the Single Market make it possible for Germany to pursue a strategy of Export-driven Wealth-creation that would be considered impossible in any other Western, high-GDP, high-population, high-wage-paying nation
European nations that have found a way to support the German Productivity Engine have built a symbiotic relationship that strengthens their union
Background: Nobody Ever Bothers To Look At The Data
Here’s some data most people never see. None of this essay makes sense if you aren’t familiar with it. It’s a bit academic at first, but you’ve got to understand it if you want to get to the entertaining stuff later. Given my focus on the Euro (as a mechanism of exchange and therefore Trade) and the Single Market (obviously about Trade) both being adopted post-German-reunification, the data I want to see is:
Who is making money by Trading with other countries, and exactly how much?
How important is that Trade to each nation?
+some way to show the massive GDP differences between nations — some business models only work at a small scale
Take a good look. The tagline here is “Germany is a major outlier among high-GDP developed nations and nobody talks about it.”:
Barely legible, I know, let me zoom in
The USA and China are massive outliers in their own right, so I’m going to shrink the X-axis and exclude them for now so we can actually compare normal nations:
Click to embiggen — The area of each bubble is based on each country’s GDP. See Notes [0] and [1] for data sourcing — I made zero adjustments, these are all World Trade Organization numbers
The X-axis here represents “money a country makes by Trading with other countries”. Countries to the left spend more money buying foreign products (imports > exports), and countries to the right make more money selling to foreign nations (exports > imports). The X-axis therefore shows how profitable International Trade is to a country.
The Y-axis here is the “Importance of International Trade”, reflected as the [ Absolute Value of Imports + Absolute Value of Exports ] / GDP. The point of the Y-axis is to show the size of Trade flows in and out of a nation relative to its GDP. Not every nation actually profits directly from Trade, but that doesn’t make the imports less important to understanding what’s going on in each country. I define this axis as “importance”, but you can substitute “magnitude” for much of the same meaning.
The Y-axis exists to show how much Trade a nation engages in. The X-axis exists to show the profitability of that Trade. Putting them together helps understand a nation better than either data point in isolation:
Take a country in the top-left — Singapore: Singapore is a tiny trading outpost nation that serves as a primary gateway between East & West. Its total trade flows (~$493B USD) dwarf its actual domestic productivity (~$324B USD), so Singapore is the highest nation on my Y-axis here. Those trade flows — both the inflows and the outflows — are absolutely critical to Singapore’s continued prosperity…
…But producing goods themselves and selling them to foreign nations is not how they make their money. Singapore profits by making a market for other people to trade in, and by offering complex financial services to help those trades happen. And so Singapore, in aggregate, does not actually produce a Surplus directly from the Trade that flows in and out of its ports. With 2017 Imports greater than 2017 Exports, they end up on the left-hand-side of the X-axis.
Take a country in the bottom-left — the United Kingdom: and you’ll note that direct trade with other countries is less important to the UK than it is for any other European country (Y-axis) and that when it does trade with others, it is not — in aggregate — a source of national Surplus (X-axis). When it comes to Exports, the UK is not even in Europe’s top 5 Exporters, with Germany (230% more), France (33% more), Italy (22% more), and the Netherlands (15% more) all coming out on top.
For those familiar with British/European economic-history over the last 200 years, this should be surprising. Indeed, when the Single Market was adopted (1993), the UK was the 2nd largest Exporter in Europe. This essay is not about Brexit, don’t worry, but if you like connecting dots in economic data…start there.
Pasted the same chart here to aid readability
Now take a country in the bottom-right — Japan: and note while they make a considerable Surplus selling goods to other countries (X-axis), this is no longer all that important to them, with only India falling below them on the Y-axis. Exports to other nations are only 14% of Japan’s GDP — 4th lowest in this data set — and at 11% of GDP, Japanese imports are the lowest in the whole data set.
Those who’ve glanced at Japanese history will know they’re no stranger to isolationism. Today’s state of affairs is not that extreme, but it’s worth noting that their domestic productivity engine and national standards of living are not particularly concerned with international trade.
Which brings us to the top-right — Germany: Total trade flows in & out of Germany are two-thirds the size of German GDP, dwarfing all other high-GDP economies on the Y-axis (64%). International trade is twice as important to Germany as it is to China, and more than thrice as important to Germany as to the USA.
And when it comes to GDP contributions, Germany is in a tier of its own — it’s not just that the Trade is important (remember Singapore?), it’s that Germany runs the second largest Trade Surplus in the world, at $250 Billion in Surplus on $1.3 Trillion of Exports. Germany earns 7% of its GDP from that Surplus — only the tiny nations of Ireland and Hungary produce more of their GDP directly from Trade. For a large, developed nation, this is quite odd…
…and it should be somewhat surprising given common Narratives that “cost of labor” is a big driver of industrial capacity reallocation away from Western nations.
Re-pasted the same chart here to aid readability
If you want the full data set, I put it in a Google sheet here. There’s too much to include in this section but feel free to explore it.[1]
There’s one more piece of data to this puzzle: who the hell is Germany selling all these products to?
German Export Partners, 2017
Yes, I also think the chart on the left would look better as a pie chart, but the UN pays top dollar to produce these charts and it’d be a shame to recreate it in a more readable format source
The main takeaway here is how diverse Germany’s customer base is — how little customer concentration they see. The USA is their largest customer and the Czech Republic is down at number 12, but the gap between the two is shockingly small (exports to the Czech Republic are ~37% of exports to the USA).
For reference, this is how customer concentration looks for the next-largest trade-surplus-generating nation on the chart, Japan:
Note the 10x delta between their top customer (USA) and their 12th customer (Indonesia) in the table on the right source
Intense customer concentration in their 5 largest customers.
Intense customer concentration is the norm here, and you can go to the source I linked, change the country tag and play with the dropdown as much as you like. Again and again you’ll find Customer #12 is a much smaller fraction of Customer #1’s sales, whether you look at Italy (Customer #12 is 17% of Customer #1), the United Kingdom (15%), France (9%), the Netherlands (5%), China (10%), Korea (6%), or anyone else.
Call it gravity, call it policy, call it a multivariate fusion of all the factors that play into regional economies, the fact remains that Germany exports more goods, in absolute value terms, to it’s 12th largest partner than any other country I linked to. Non-europeans might tend to lump “the EU” into a single trading bloc to make this stuff more digestible, much like we lump wildly differing US States into “the USA”, and that’s a fair move. In fact it’s a decent comparison. Either way, when Industrial Capacity reallocates, tens of millions of people are affected.
But unlike the USA, the winners & losers of Europe are not united under the same Federal umbrella.
In summary, Germany is an outlier, with huge international Trade surpluses that are integral to its GDP — despite high costs of labor, high standards of living, high tax rates, and no good maritime ports — and the most diverse customer base of any Exporter nation.
The only country that looks remotely similar to Germany is Korea, and the last time I saw those two mentioned in the same sentence was when Korea knocked Germany out of the 2018 World Cup.
A China-USA Manufacturing Case Study
The USA-China relationship is so hilariously distorting that you have to remove it from charts to be able to see anything interesting about other countries. Which makes it a perfect place to start a brief case study on what could potentially happen to a mature, high-GDP, high-wage-paying, high-standard-of-living industrial nation when it loses an Industrial Manufacturing competition.
(If this is already familiar to you, or if it gets too boring, skip ahead to section iv)
If you were a 1990s German minister trying to plan for the fall of the Soviet Union (1991), the loss of a common enemy that unites Europe, national-reunification, and the opening up of Trade Routes that had been behind the iron curtain, — and if you could travel into the future and witness Chinese-American economic interactions — you’d learn exactly the right lessons to help you guide reunified-Germany to European prominence and national prosperity.

Cue dry academic intro quote:
Mainstream economists have long argued that international trade improves welfare. While trade may redistribute income, theory assures us that under standard conditions the gains to winners are more than sufficient to offset any losses incurred by those suffering adverse effects from foreign competition…Paul Krugman states this view vividly…“If economists ruled the world, there would be no need for a World Trade Organization. The economist's case for free trade is essentially a unilateral case: a country serves its own interests by pursuing free trade regardless of what other countries may do.”
The above is the introductory paragraph to the 2016 paper by Autor (MIT), Dorn (University of Zurich), and Hanson (UCSD) titled: The China Shock: Learning from Labor Market Adjustment to Large Changes in Trade.
The paper is focused on understanding the effect China’s rapid industrialization+globalization had on US labor markets. I’m going to quote (3) sections from it, labeled with a number just like that, and you’ll have to trust me that they’re fair summaries because I want to get the lessons over with quickly so we can apply them to Europe, the Euro, and the Single Market. Read the whole paper if you want to learn more.
i) It Is Possible To Straight Up Lose At Trade
(1)
The reduced-form analysis suggests that the reallocation of labor across U.S. industries and regions in response to increased competition from China does not produce an offsetting increase in employment by other U.S. traded-good industries, as the simple logic of neoclassical trade theory would have predicted
While no economic theory is perfectly able to capture the complexity of reality, neoclassical models are useful because they’ve proven mostly accurate at describing the modern global economy. When reality fails to conform to those models we have two options:
i) the models lacked data that would have changed their predictions or…
ii) the models’ fundamental assumptions about reality were not true in this case (despite being true in the general case).
What we can’t do is ignore the mismatch between reality and our expectations. We expected Trade to be Net Good, because it is in the general case. For vast swathes of America, the reality was Net Bad.
Suffice it for this section to note the possibility that international competition can reduce employment in one geographic region without producing an offsetting increase in employment in that same region. That shouldn’t be too controversial.
ii) Manufacturing Network Effects: 1 + 1 = 3, but 3 - 1 = 0
Everyone in Tech knows all about the magical power of Network Effects. People have been writing books about it since before Facebook took over the internet. But comparatively little has been written about what happens when those exact same effects run in the opposite direction:
(2)
Employment has certainly fallen in U.S. industries more exposed to import competition. But so too has overall employment in the local labor markets in which these industries were concentrated. Offsetting employment gains either in export-oriented tradables or in non-tradables have, for the most part, failed to materialize. Input-output linkages between sectors appear to have magnified rather than dampened the employment effects of trade both within regions and nationally.
And they include this helpful graphic:
“Geographic Exposure to Trade Shocks at the Commuting Zone (CZ) Level” Note that those brown areas are bigger than most European countries.
It’s academic, I know, but there are 3 core points expressed in that one quoted paragraph that explain how 3 - 1 can equal 0:
Manufacturing productivity can generate enough geographically-localized Surplus to support a range of supporting business & employment. When the primary “Surplus Engine” is removed from a local community, the surrounding non-Manufacturing businesses lose all their customers too. This effect is intensely localized, with dark-brown regions in the graphic above experiencing the brunt of it.
Increased Consumer Surplus thanks to lower prices from foreign goods can increasingly only be spent on purchasing even more imported goods or on domestic services-based industries, accelerating the relocation of productive Manufacturing
Manufactured goods are made up of other manufactured inputs (consider: a car, an iPhone). Network effects between firms create healthy local economies, drive wages up due to competition for labor, and provide entire geographic regions with economies of scale. When lynchpin firms are somehow replaced by more competitive foreign offerings, they take that entire Manufacturing Network with them too — their suppliers and manufacturing peers. Poof. Magical Network Effects magnify all effects, positive and negative.
Regional economies tend to grow around a handful of businesses in a single industry, with hundreds of thousands of jobs and literally-millions of years of work-experience dedicated to supporting that industry, both directly (suppliers, accountants, lawyers) and indirectly (restaurants, taxis, barbershops).
Someone in a region must Produce a large Surplus in order to support all the other economic activity.[2] When that ceases to be true, when the dominant industry is removed, you get a gaping hole at the center of your local economy’s Network — those who can emigrate to greener pastures do, and the Government has to step in to support those who can’t via social safety nets:
sourced from the same paper
Translation: For every $100 in products imported from China per person, the US Government had to hand out $6 in incremental social safety net benefits. They call them “Transfer Receipts” because that $6 ultimately had to be produced by someone doing something productive elsewhere — which makes it a “Transfer”. Governments are powerful, but they can’t wish money into being. (Not sustainably, anyway)
3 - 1 = 0.
iii) Exchange Rates Are A Cheat Code For Selling Stuff — You Might Not Be Willing To Cheat, But China Is
But if Networks are so god damn powerful, how did China overcome the inherent stickiness of US Manufacturing Networks and reroute global manufacturing & its associated trade flows to Chinese firms?
The undercurrent to that question of course being: “how might Germany circa 1990 avoid being undercut by Chinese firms and build an Export-driven Manufacturing Network of their own, despite high-wages, high-living standards, and high tax rates?”
(3)
A third distortion advanced by think tanks and politicians in Washington, D.C. (see, e.g., Cline, 2010) is that China has consciously undervalued its nominal exchange rate so as to promote its exports
When China undervalues its currency, Chinese goods start looking real cheap. Foreigners then buy way more Chinese goods than they otherwise would have, bootstrapping China’s Industrial Manufacturing abilities with cash, customers, supply chains, and technical knowledge.
It’s hard to understate how impactful this is. Seriously, it’s like a Cheat Code for Selling stuff.
40-Year US Dollar-Chinese Yuan Exchange Rate:

In case you’re unfamiliar with this stuff, normal 40-year exchange rate graphs don’t have this many straight lines source
But undervaluing your currency ain’t easy. You can’t just wave a magic wand and decree the value of your coin. You have to put real, tangible money to work counteracting the natural market forces, and you can’t ever stop because one correction will undo all your spending. In many ways the price of your currency is a reflection of how desirable your whole nation’s economy is — when you make something people want, the free market bids up the price.
So the tricky thing about messing with currency markets is that the more successful your nation is, the more expensive it becomes to fight the free market and maintain the fiction of a cheap — undesirable — currency.
How have the Chinese been able to maintain their fiction?
Many nations have tried and failed to manipulate their currency’s exchange rate, most notably (to me, personally) the British in 1992, who hoped to maintain an overvalued currency for reasons of national pride and politics. To do this the Bank of England bought billions of Pounds and then held them, doing nothing with the money, mimicking market demand for their currency that did not exist.

I’m not kidding, this was actually their whole strategy. Unironically. Also, note how ripe for political abuse this sort of fiscal policy can be in a democracy — voters can be fooled that your policies are working by the actions of a few bankers and couple of newspaper headlines
George Soros famously bet against the Bank of England, by borrowing British Pounds from private lenders and immediately converting them to German Deutsche Mark at the insanely inflated exchange rate being offered by the Bank of England. When the Bank could no longer afford to keep buying Pounds and stashing them in the basement, the exchange rate collapsed — and Soros made $1 Billion by converting just a few of his German Marks back into tons of British Pounds, way more than he originally borrowed, paying off all his British loans, and pocketing all the left-over Marks. Smart guy.
The German economy was booming. Britain’s was floundering. Nobody wanted Pounds and the Bank of England broke itself trying to pretend otherwise.[3] The day it happened is known as “Black Wednesday” in the UK — incidentally my 1st birthday.
But China is not Great Britain and they want the opposite thing — an undervalued currency, not an overvalued one.
So they need to do the opposite to the Bank of England — they need to stash foreign currency in their basement instead of their own currency:

You read that as “Trillions”, by the way
Like the Bank of England “buying” up Pounds and stashing them in a vault, the Chinese have 3 Trillion dollars-worth of currency from their “Customer-nations” stuck in a mattress.
Exactly how much of the $3 Trillion is actually held in Dollars vs. Euros vs. Yen is a classified state secret, but the expert consensus is ~2/3rds are Dollars.
Is $2 Trillion enough to meaningfully support an undervalued currency? Perhaps not by itself — it’s just one part of a holistic strategy.
They also make it a serious crime to trade Yuan outside of their published Peg.
And they increase the total supply of Yuan each year by more than double the increase in US Dollars. When you make more of something, it gets cheaper, and China makes sure there are many more Yuan than Dollars produced each year:
Chinese Money Supply (Yuan):
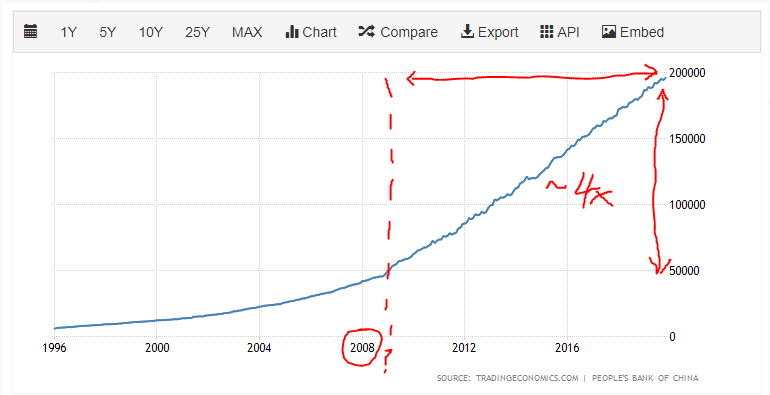
~4x increase in Chinese Money Supply since 2009. Some critics have noted that the Chinese response to the 2008 crisis was to print their way out of trouble. I leave whether or not there’s an inflection point here to the reader to decide source
US Money Supply (USD):
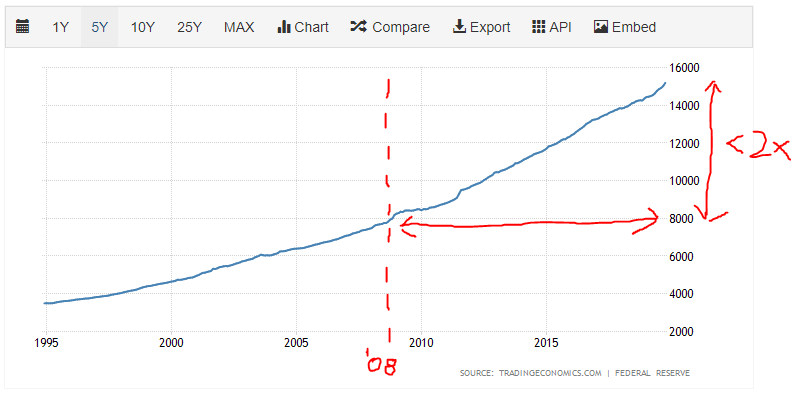
<2x increase in US Money Supply since 2009 source
I’m not here to argue about the exact money supply numbers, and it seems certain that Chinese interest rates should not be the same as US interest rates. Though I doubt it, it’s possible that these two sets of figures are exactly optimal for both nations and are unrelated to exchange-rate-games — I just want to show that China is executing a consistent strategy at all levels of the Currency game.[4]
If you’re a magical time traveling German minister from 1990, this entire section should be a terrifying glimpse of the potential future that awaits you when you try to build your manufacturing industry — you best start thinking of a plan to avert it. China and those who would play China’s game — playing to win — are coming for your Exports.
iv) The Currency Problem: Trade Isn’t All That Matters
Germany has a much bigger problem than Chinese cheating policy efforts.
Any armchair student of today’s macro economic / geopolitical environment should know that exchange rates are much more complex than a 1:1 correlation with demand for manufactured goods.
Even non-students should be familiar with the term ‘Reserve Currency’ — and know that it refers to currencies that the market views as stable, secure, and a sensible place to park your cash & investments. Today that means: US Dollars (62% of all global reserve holdings), Deutsche Marks (16%) German Euros (20%), Japanese Yen (5%), and British Pounds (4%).
Compare 1995 Pound/Franc/Mark Reserve Holdings to today’s Euro holdings to put 2 + 2 together (click to embiggen)
Many folks are also familiar with the fact that Oil is priced by OPEC in US Dollars, not their respective national currencies. Super carriers parked off Saudi Arabia’s coast help maintain that particular fiction.
If you want to buy Oil, you must first visit your local exchange agent and buy some Dollars.
Which means the demand for US Dollars is pushed up by non-manufacturing-related causes.
High demand for Dollars means Dollars are expensive. That makes products Manufactured in the US expensive for foreigners — and therefore hurts US Industrialist Exporters, regardless of US industrial policy efforts.[5]
This is super great for China, as it provides an external source constantly applying upwards pressure on the value of the Dollar/Euro/Yen/Pound — i.e. all of their customers!
And it’s super frustrating for Trump & Bannon & crew, who’d like to spark some sort of US-based Industrial Manufacturing revival via Federal policy — which is like throwing gas on a fire in the midst of a rain storm and planning to stay warm and dry. Whoosh. Bang. Still gonna get wet.

You might get a big spark, but those trees are gonna stay wet — too wet to catch fire
That same upwards pressure exists for all Reserve Currencies. Japanese Electronics Manufacturers were crushed by the 2008 crisis response — when the rest of Asia perceived the Japanese economy as a relatively stable safe haven and bought Yen in response, it naturally pushed Relative-Demand for Yen up and made the currency more expensive. Japanese manufacturers had to lower their prices (and thus profits) to remain competitive internationally or go out of business:
Red line = what it costs to make stuff, Blue line = what you sell it for. Gap between the two == the opposite of profit. source
Lower profits mean lower investments, because no sane firm would pour more money into a money-losing enterprise, which means Japanese firms fall behind technically as well, and at that point you’re in a market-share-losing death spiral with no capital, no technology, and no profits:
Pictured: (╯°□°)╯︵ ┻━┻ source
The tendency of major Industrial Manufacturing Powerhouses to become mature, stable, regionally dominant economies leads inevitably to their currencies becoming Reserve Currencies — undermining the manufacturing success that made their economies so great in the first place.
Thus: “Currency Problem.”
For Germany — the Reserve Currency of Europe, 20% of all Global Reserve Holdings in 1990 — the inevitable wrath of currency markets are prosperity-destroying bad news.

The interesting thing about this perspective is that it suggests the location of productive manufacturing activity is not driven by the cost of labour (supply-side), but by the ability of eventual-customers to actually purchase your finished products (demand-side). Because these two separate items are usually aligned with each other it’s easy to mistake one for the other, and there’s definitely much truth to the supply-side Narrative.
But the example of Germany — the second largest Export economy in the world, despite high costs of labor and modern Western standards of living — speaks to a bigger picture.
Changing Lenses — The Corporate View
The value of Narratives and Lenses is in switching them out and seeing how different the same phenomena look. So take 250 words and 1 image to swap the National Lens out for the Corporate Lens here:

Pictured: you for the next 250 words
The modern corporation is distinctly non-Nationalistic. Dollars are dollars, profits are profits, trade routes are open, labor is fungible, and tax havens are just offshore of every major market. Don’t hate corporations for playing to win — they don’t make the rules, you do.
Which means…
Expensive US Dollars can be invested into Cheap Chinese Yuan, turned into factories, turned into finished goods, capturing huge market share and profits and increasing Firm Value. And then the Chinese government will spend thousands of man hours from their brightest minds and literally-Trillions-of-Dollars to maintain the competitiveness of your firm and prevent another geographical location from lowering the value of your investments by outcompeting you.
Imagine you’re a company executive and read that bold part again.
No investments are sure things, and we of course do see some labor reallocating away from China despite the CCP’s best efforts, but then the same rules will eventually apply to those other countries as they industrialize and reach parity, and then they will see their own markets undercut in turn. China at least offers (the allure of) unmatched stability and the closest any Industrialist can come in 2020 to a “guaranteed” annuity cash flow — so long as you remain in the CCP’s good graces.
Refer to the graph above of Japanese Exchange Rates vs. Prices to see an Industrialist’s worst nightmare — caused by factors entirely outside their control.
This gives the CCP a lot more leverage over company execs than folks realize. South Park was right, but it’s not just about the revenue opportunity that comes from selling into the Chinese market. They’ve been running a full court press of mercantilist-industrialism for ~4 decades in order to build the largest Manufacturing Network in history — and any equity holder who wants to can personally benefit from CCP protectionism if they ante up.

Spoiler: if you’ve got a 401k, your retirement money is invested in the stocks of US companies that have been doing exactly this, which makes you an equity holder in CCP Protectionism — make sure to vote in your own best interest! source
It’d be a borderline-criminal violation of fiduciary duty to ignore these sorts of incentives!
v) Germany’s Doom: The Inevitable Cost Of Success
I’m not China and I’m not the USA. I’m not Conrad Bastable. I’m a time-traveling German minister from the end of the Cold War (1991). I’m here looking for practical lessons because I manage Europe’s fastest growing and most efficient Industrial Manufacturing Powerhouse. I wish to learn from the (future) fall of US manufacturing and avoid such a miserable fate.
I’m not so worried about our ability to produce — Germany has been Europe’s industrial powerhouse for 200+ years. Making stuff is what we do. We don’t need Foreign Investment, we’ve got enough domestic capital.
I’m worried about the effect that our inevitable success will have on the relative attractiveness of our exports. As we rebuild, we will produce. As we produce, our economy will become the strongest in Europe. Which will make our currency the strongest in Europe —
— which will make our Exports expensive, and then it becomes capital-efficient for our corporations to export their productive capacity — their factories & jobs — to our neighbouring states, who will have cheaper currencies and cheaper labor.
The “Currency Problem.”
And reunification means that our immediate Eastern neighbors are about to have a direct pipeline through all of mainland Europe.
Inconveniently, those same states are where the USSR focused its industrialization efforts.

Circled: lots of cheap labour & idle factories
All we need is for our goods to be attractive throughout Europe, regardless of how other nations’ economies are performing relative to ours (and they will underperform), and regardless of how many Cheat Codes other countries try to run.
And we need to offer a Trade framework which makes it Economically Efficient to maintain Industrial capacity — factories & jobs — within our borders rather than reallocate it to other Eurasian nations.
We need a Trade framework that lets our goods move freely to our customers, but puts just enough obstacles in front of Chinese goods that it makes sense for our corporations to keep their industrial capacity here, in Germany.
Enter stage left:
vi) A Solution To Currency Problems and Trade Cheats


Both of the above were introduced, formalized, and adopted in the Maastricht Treaty of 1992. The explicit 3rd criteria of joining the treaty was not having devalued your currency during the prior two years. Seriously, no Cheat Codes allowed. Other criteria included: ultra-low inflation, low government debt-to-GDP ratios, and low interest rates.
These are all reasonable criteria to achieve the stated goal: “maintain price stability within the Eurozone even with the inclusion of new member states.” I’m not knocking them. I’m just pointing out that the criteria preclude anyone running even half of China’s playbook from joining. Government-funded winners? Cheap exports? Printing currency? Strike, strike, and strike.
Price stability, of course, explicitly favors the existing market equilibrium. It is exactly by radically disrupting “price stability” that China was initially able to build its international Manufacturing Powerhouse.
It is a failure to maintain “price stability” that so wounded Japan’s electronics industry.
Nobody wants "price stability” until they are on top — and then they want it very badly.
Obviously there’s plenty of good to stable prices (see: the Corporate Lens section above), and uncontrollably high prices have precipitated many of Europe’s prior woes. You can see why it was picked as a goalpost by glancing at Germany’s history lessons from the 1920s:

Pictured: unstable prices. Not pictured: what came next.
I just want to make it clear that “stability” implies some measure of continuing the status quo and makes China-style competition much harder.
vii) The Single Market Prefers A Single Producer
The Single Market functions to maximize Free Trade and eradicate barriers to competition — within Europe. Meanwhile, selling into the Single Market from outside Europe is met with a slew of regulations, tariffs, and general headaches.
This setup allows European nations to compete with each other on their capabilities and the efficiency of their productive capacity, while sheltering the continent from external producers.
Any student or practitioner of business knows that an easy way to make an industry more “efficient” is to remove “shared costs” by rolling up a few players under the same corporate umbrella: In order to run a big business, you need an accounting department. In order to run two big businesses in the same industry, you need two accounting departments. That’s obviously grossly inefficient (sorry accountants), and so the tendency of most major industries is to consolidate:

I hope the parallel between “Industry Deregulation Promotes Company Consolidation” and “National-trade Deregulation Promotes Geographic Consolidation” is somewhat clear. Source here is the Harvard Business Review, so this is pretty mainstream stuff
What is true of Companies is true of Industries.
And so when we look at the USA, we see: Tech consolidates in Silicon Valley. Media consolidates in LA. Finance consolidates in New York (advisory) and Chicago (trading). And Manufacturing consolidates in the Midwest Rust Belt:


The same is true of a Europe that operates under a Single Market. Geographic consolidation is an expected outcome of free trade — the efficiency gains from consolidating regional knowledge, workplace culture, education systems, financial networks, transportation networks, distribution networks, and removing duplicative cost centers are far too great to ignore.
Look, I — Conrad, not the German minister — have had 3 cups of tea while writing this, and plenty of chocolate, so I know it sounds conspiratorial to suggest this was at all pre-planned. Obviously much — most — of what happened here was happy accidents of fate and a wise studying of history, not the magical action of a time traveling financial & industrial wizard. You’ve got to squint to see a single Narrative with clarity when reality is multivariate.
But consider this sentence, at the very top of the wiki describing the European Single Market:
The market is intended to be conducive to increased competition, increased specialisation, larger economies of scale, allowing goods and factors of production to move to the area where they are most valued, thus improving the efficiency of the allocation of resources.
The direct implication of increased competition is larger economies of scale and geographic consolidation.
That incident I described a few thousand words ago — where George Soros justly broke the Bank of England for the sin of trying to lie about the value of their economy currency — happened September 16th, 1992.
The Single Market launched just four months later, in January 1993, though something like it had been in the works for a while. But on that launch date was there anyone in Europe with any doubts about which nation — which “area” — was ascendant, economically speaking?
Any doubt about where the “goods and factors of production” would move when they were allowed to move freely?
In the words of a famous German:
Germany: “Yes.”
Note: don’t read my tone wrong here, I’ve nothing but intense admiration for the political and economic leaders of Germany, who guided the state back to profitable Industrial Exporting preeminence when its future was deeply uncertain and providing growth was necessary to the successful reunification of their divided nation. The British, French, and other major European states took their industrial capacity for granted, treated it with neglect & contempt for decades post-WW2, and don’t seem much keen on having it back. In the words of another famous European: never interfere with your neighbour when he is making a mistake.
viii) An Economic Union Beats Cheating at the Currency Game
The German Euro — the currency — has its value suppressed via contamination with all the other (poorer-performing, non-Exporting) European nations.
This means German goods look much more attractive than they otherwise would to non-EU markets (i.e. USA & China, Germany’s #1 & #3 customers, respectively)…
…Providing a positive feedback loop on the existing Single Market incentive to centralize the location of manufacturing activity.[6]
The Euro allows workers in Spain to use their own Euro-denominated wages to purchase German Euro-denominated goods without the tricky fact that the German economy is massively outperforming theirs getting in the way of the exchange.
Remember what happened to the Japanese electronics industry when the Japanese economy was seen as outperforming its neighbours?

Pictured: just a meme that made me laugh
And it means those same workers in Spain are less equipped to compete for Manufacturing jobs — because Elon Musk has to pay them in German Euros instead of cheap Spanish Peseta. If you’ve got to pay everyone in German Euros, you might as well get the most productive workers for your “buck”, right?
I don’t think they have siestas in Germany…
Germany doesn’t need to cheat at Currency games in order to build their exports when their economy is averaged with the likes of Greece and Spain.
And so our favorite Industrialist Capitalist — who cares nothing for national politics and everything for delivering good physical product on time with good profit margins — makes the obvious choice when it comes to Europe:

Anywhere else would be foolish. The CEO has a fiduciary duty to uphold, and his institutional shareholders represent real people’s pensions that cannot be allowed to go bankrupt. That means you & me. Tesla’s largest shareholder manages 5 of the 7 largest pension funds in the USA. So say thank you to Elon for making the profit-maximizing choice here — just like everyone else did.
25 Years Later — How The Data Changed
Multiply this same choice across a thousand firms, a million employees, a few billion in combined Enterprise Value…
And you get Germany.
The world’s second largest Export economy.
Able to support the most immigration of any EU nation with jobs a-plenty, a large welfare state, an efficient & strong military, a currency that functions as the world’s second-choice reserve currency, bailouts for their neighbours who flounder, low & still decreasing unemployment, high standards of living, and a thorough integration of Finance, Trade, and Industrial Production that no other modern Western democracy has managed.
Able to build this in 2017:
This is the chart from the beginning of this essay
Out of this (same chart, same data, same nations, but ~25 years ago in 1993, in the first year that the European Single Market launched, expressed in constant $USD-2017):
Note [7] on why Japan had to be cut from the picture (the ’90s weren’t so good for them)
It’s the same chart, you read it the same way.
Moving up the Y-axis since 1993 means Trade became more important to a nation relative to their GDP. Almost everyone moved up by 2017, some more than others.
Moving right on the X-axis since 1993 means a nation makes more of its money from selling to others than they used to. Some folks moved right, some moved left.
Conclusion
The cynical reading of these two charts — of the history of the last ~25 years in Europe — is:
Germany and Italy have done very well for themselves since the adoption of the Euro and its Single Market, turning regional manufacturing dominance into maintainable Trade surpluses. No further comment on that duo.
Ireland too — who now runs a $100B Trade Surplus (5th largest in the world!) thanks to its location and “unique” relationships with the USA, the UK, & Europe’s Single Market (ctrl-f for “Ireland” in this piece for a laugh).
The United Kingdom, the Netherlands, Belgium, Spain, and Greece…have fared poorly when it comes to direct benefits from the shared currency & its single market. Those nations all used to run some of the largest Trade Surpluses in the world — yes, even Greece. Economic interactions with the rest of the continent were a source of national profit…
Competing against Germany is a losing play for anyone who’s ever tried to make stuff, and we should continue to expect industrial capacity (jobs/factories/capital) to flow out of the UK/Netherlands/Belgium/Spain/Greece/France and into Germany — “where they are most valued”.
Note that “flow” implies new Capacity is built in Germany (see: Tesla tweet above) more than a literal movement of existing physical locations.
The less cynical reading is:
Non-German, non-Italian European nations have found meaningful alternative domestic engines of GDP-growth that do not include profiting from selling things to other countries!

Pictured: The Spanish/Greek/Dutch/UK/French strategy
I know I usually go all-in on the cynical readings, and the meme doesn’t help, but it’s worth expanding on that for a moment.
When it comes to the United Kingdom, this should make some sense given it’s a “Reserve Currency” nation operating as the defacto financial capital of [ Europe + the Middle East + Northern Africa + Russia ].
We would expect all the finance-industry activity to drive the price of the Pound up much higher than it otherwise would be, and therefore to push United Kingdom-based Industrial activity right out of the United Kingdom, regardless of any Euro-based shenanigans. This also matches with the observation that, economically-speaking, the United Kingdom has become a one-city nation (London, i.e. Finance), with prior hubs of maritime trade and/or manufacturing fallen to irrelevance (Liverpool, Birmingham, Manchester, etc., don’t follow those links if you’re in a cheery mood).[8]
British expats in America (hi that’s me) are sometimes asked “what part of London are you from?” — and while the question might be irksome, it reveals a deep economic truth:
The United Kingdom has found another path to GDP generation, and it’s to the economic benefit of 4 continents & 1 city that London’s financial center remains undiluted by weaker European nations — that they have somewhere strong and stable to park their currency, outside the long arm of EU bureaucrats, and whose economic value is not subject to the fluctuations of trade flows.
Remember Singapore? You don’t need to profit from the Trade itself so long as you can attract the movement of goods, services, and capital to your borders.
Likewise, the Netherlands and Belgium have both found alternative paths to prosperity by structuring their economies around tremendous volumes of Imports & Exports relative to their GDP. “The Singapore of Europe” is an apt description:

The density of roads (transportation networks) should tell you how German Imports & Exports are getting in and out of Germany — and who is able to benefit by making a market for them and taking a small slice. The number of cities that Google’s algorithms choose to show for each nation at the same level of zoom is also deeply revealing about the distribution of economic-relevance. Paris looks lonely indeed.
China :: Singapore as Germany :: the Netherlands.
The takeaway — from this whole 6,000 word essay — is that Germany has done insanely well for itself since the creation and adoption of the Euro and the European Single Market by pursuing a strategy of Export-driven Industrial production that is considered impossible in any other developed, high-GDP, high-population, high-wage-paying nation.
Indeed, it would not be possible without the existence of the Euro and the Single Market.
The German economic engine sits at the economic-center of the continent, generating growth for the whole entity.
Winners and losers might net-out, and in aggregate the gains to winners might even outweigh the losses experienced by losers (shoutout to Econ 101), but the nature of Distance / Time — the nature of geography — is that “losers” can encompass regions the size of European nations and populations of 10s of millions.
When it comes to Europe, those regions are usually not under the same Federal umbrella as the winners. They do not have the same tax base.
How that plays out — politically and economically and culturally — over the next 25 years is for the pundits & prognosticators to guess.
How it has played out over the previous 25 years is described by the intersection of uncontested Facts and hotly contested Narratives.
In today’s world of post-truth propagandizing, you can choose your own Facts and you can choose your own Narrative. What you can’t choose is your nation’s bank account balance. If you care about increasing it, you should know how others have succeeded.
Consider the lessons of this case study carefully — who has won, who has lost, and how they ended up where they did — and choose your own adventure.

“Germany: Master of the Industrial Arts”
Notes
[0] Note: I excluded a handful (5) South-East-Asian & South American nations to aid clarity of reading and because this essay is about the USA, Europe & Asia. You’ll also note that the USA and China both had to be cut from this image because the sheer size of their GDP made the rest of the chart unreadable.
[1] Everything is sourced directly from the UN & WTO’s official data repository, including GDP numbers, and expressed in constant 2017 USD, which is great because one of the worst things about this sort of data is trying to unwind different people’s adjustment factors that never quite tie
[2] The alternative is subsistence, and that’s no fun at all.
What does the decline of manufacturing regions due to foreign competition look like in practice? US residents — real individual people — whose personal income is not threatened by a reallocation of trade to foreign firms might perhaps see large increases in their personal standard of living thanks to their additional consumer surplus. Well-positioned Economic Rent-Seekers might then raise their prices steeply to take advantage of the extra cash in the pockets of consumers. Consider: housing, health care, education.
US residents — again, real people — whose real personal income is reduced by a reallocation of trade to foreign firms can choose to retrain (“Learn to Code”), enter the workforce in non-scalable Services-based industries, and relocate to urban centers or else commit to a permanently lowered standard of living thanks to their inability to compete in the aforementioned Rent-Seek’d areas.
Expectations: bifurcation, urbanization, increased polarization along rural-urban divides, increased Wealth inequality, increased Debt chasing non-productive assets, increased government assistance, increased competition for a smaller number of Wealth-generating jobs, etc.
This loosely matches my mental model of the Industrial world, not completely, but enough that I can see the shape of a viable Narrative beginning to build. I wrote earlier about the dramatic rise of Industrialism:
“Consequential path dependence in the location of economic activity” isn’t exclusive to Feudal Rome. To spell my point out more clearly: The Town is to Feudalism as the Trade Route is to Industrialism. Sticky, self-perpetuating, network-effect-creating, often a Nash Equilibrium, and increasing of market Imperfection in a way that allows existing-participants to Capture Wealth.
“Stickiness” is great when you’re building something, but if you’re a legacy incumbent and a new market entrant is somehow able to pry a lynchpin node away from you, that same “stickiness” can unravel your whole local economy.
[3] Chasing money gets you both money and prestige. Chasing prestige gets you neither.
[4] What I mean is that it’s possible to show that the Chinese Money Supply is in fact not expanding fast enough to handle their economy’s growth, and that the mismatch in US-China money supply growth is such that the US dollar would actually tend to get cheaper.
I dislike these sorts of arguments because they are so many levels removed from a core base of agreed-upon axioms (i.e. cause and effect relationships at the macro level are tenuous, multi-variate, often mislabeled, and lagging).
If this were the sole exhibit in my “case”, I’d dismiss my own case — but then that goes for everything else in the essay too. Each example is just one tiny lens in the Narrative — insufficient alone to build a Manufacturing Powerhouse in the face of network effects…
…but when you stack them all together, a picture begins to resolve itself.
[5] Fun fact, the US just became a Net Oil Exporter for the first time in 75 years. We produced more Oil here at home and sold it to other nations than we imported.
The fact that Middle-Eastern Oil is priced in Dollars — and therefore foreign-produced Oil cannot be sold more cheaply via exchange-rate manipulation — really helps smooth out geopolitical instability.
If foreign Oil wasn’t priced in Dollars, the Oil we produce here in the good ol’ US-of-A would not sell nearly so well on the open market.
[6] Per the US-China case study, this implies some amount of “Transfer Receipts” — i.e. Government assistance — will be required for citizens of the regions that see said Industrial Capacity move itself too Germany.
Are those citizens located in regions where social safety nets are politically favorable?
Are those citizens located in regions that have another source of Economic Surplus that can be taxed and redistributed easily — without encouraging that source of Surplus to move as well?
One hopes the answers are Yes, and Yes.
But I’ve been to Liverpool, Birmingham, and Manchester…
[7] Note: I had to change the axes otherwise the chart was unreadable in 1993, just a big clump of dots. Note how tiny the X-axis is now — 1/10th. Also note that TRADE in general is now larger relative to GDP for every single country in this list — except Singapore, who had to be cut from this 1993 chart because they tripled the Y-axis. Lastly, Japan also had to be removed because they ran a Trade Deficit of -$158B in 1993. Look where negative-$158B would be on this X-axis relative to all the other dots and you’ll see why…
[8] A small irony is that if the United Kingdom had gone full Euro-fanatic 30 years ago, they might have weathered the German Industrial storm better as they would’ve benefited from all the Euro-based currency-dilution in all the same ways Germany has. When it comes to making stuff, I wouldn’t bet against Germany, but it’s worth noting the possibility.
- Background: Nobody Ever Bothers To Look At The Data
- A China-USA Case Study
- The Currency Problem: Trade Isn't All That Matters
- Changing Lenses - The Corporate View
- Germany's Doom: The Inevitiable Cost Of Success
- A Solution To Currency Problems & Trade Cheats
- The Single Market Prefers A Single Producer
- An Economic Union Beats Cheating At The Currency Game
- 25 Years Later - How The Data Changed
- Notes